Tables: columns and rows
Products, services, events — filled in the editor and shipped with the app.
Where: The left panel → the Data tab → Collection.
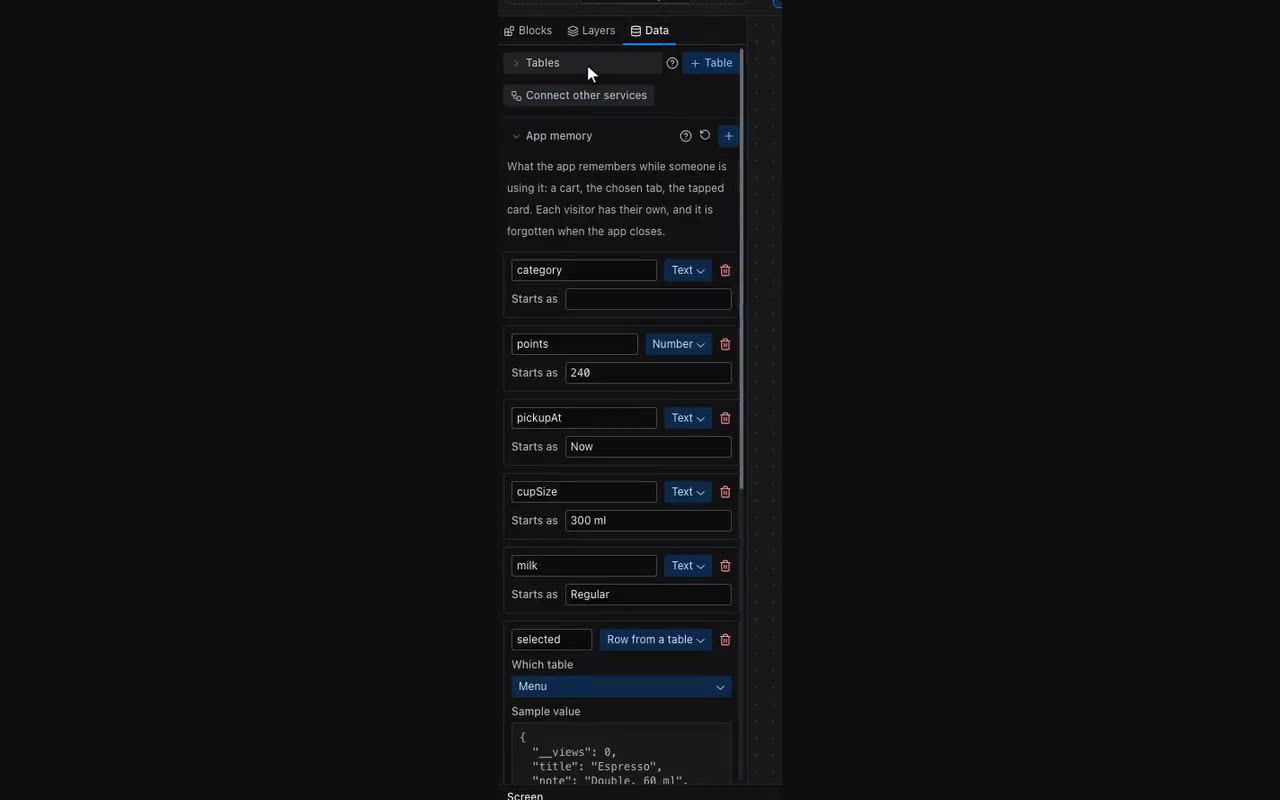
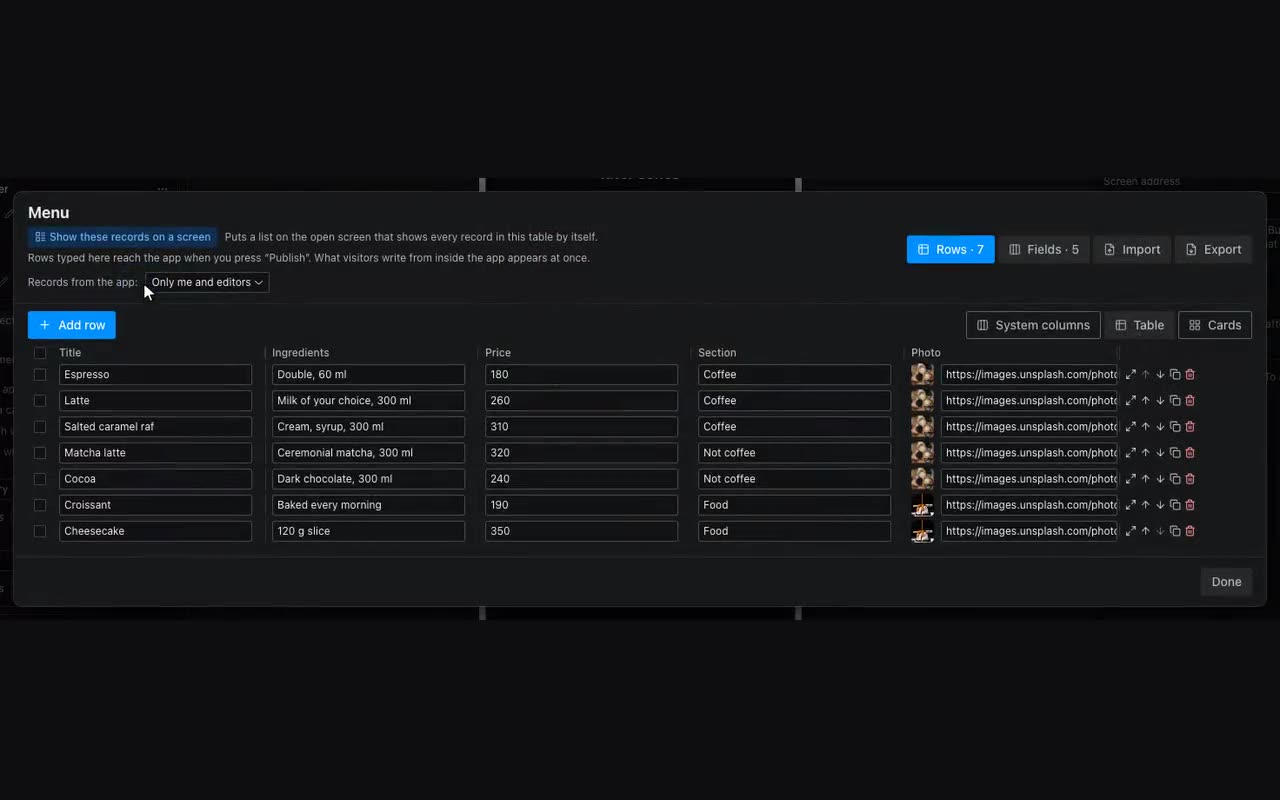
A table (called a collection in the interface) works like any spreadsheet: fields are columns, items are rows. No server is required: the data ships with the app when you publish.
A field has a label you see and a key — Latin letters, digits, underscore. The key is how the field appears in the app: {{item.price}}. It is easiest to start from a ready-made set of columns (Products, List) and adjust from there.
The table itself has a technical name too — it sits under the title in the Data panel. Lists, actions and records the app has already saved find the table by it, so it is not edited casually: the pencil next to it opens the field and warns that all of those keep the old name.
Rows are filled right there. Columns can be reordered, widths dragged, a cell expanded in full; on a phone the Cards view is easier.
Once there are more than eight rows, a search appears at the top. It covers every column at once, so you can look by title, by hall or by date without thinking about which column holds it. Several words are all matched, in any order. Next to it you can see how many rows were found out of how many.
Rows can be sorted by a column: hover its header and press the arrows icon — Ascending or Descending. Dates are compared as dates, numbers as numbers, “Hall 10” comes after “Hall 2”, and empty cells go to the bottom either way. Row order is what a visitor sees, so sorting rewrites the table itself — the previous order comes back with “Undo the order” in the message that appears at the bottom.
Every row has a checkbox on the left. Tick a few — or all of them at once with the header checkbox, which selects whatever the search currently shows — and a bar appears above the table: how many are selected, Duplicate and Delete. That is how last month’s listings go in one action instead of twenty presses on a bin icon. Deleted rows come back with “Undo” in the message at the bottom; rows created inside the app itself are deleted on the server and cannot be undone — the message says so. Changing the search or switching to Cards clears the ticks: acting blind on rows you cannot see is not on offer.
The System columns button above the table shows what the system fills in: Row ID, Added and Changed, each on its own. The row id is what you name in a relation or in a support message; the timestamps belong to rows created from inside the app (rows typed in the editor show a dash — the document is stored as is). They cannot be edited, and the choice is remembered in this browser rather than in the project.
Filling a table by hand is not the only way, and often not the best one. A price list already typed in Excel or Google Sheets is imported as a file (see “Importing a table from a file”), and if it keeps changing, the table can be connected to a live source so the rows keep arriving on their own: a Google Sheet, a workbook on Yandex.Disk, or any address answering JSON — which covers NocoDB, Teable, Baserow, Airtable and your own API (see “A live table as a source”). Rows can also be pushed in by a scenario in n8n or Make — see “Automation”.